Excel Overview
Overview
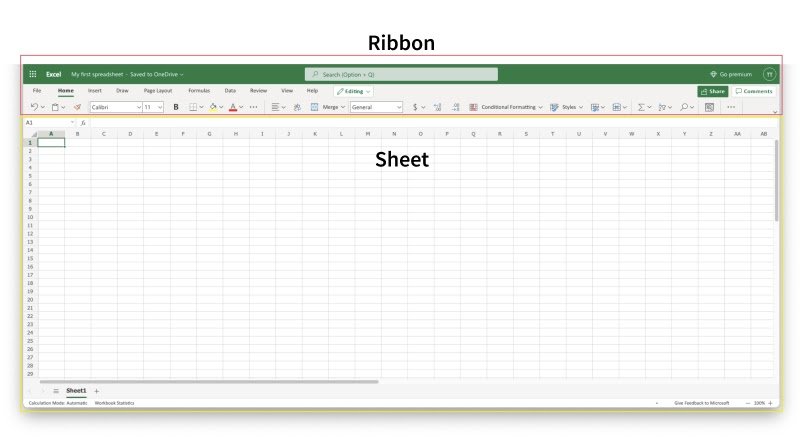
We’re going to give you an overview of Excel in this chapter. The Ribbon and the Sheet are the two components that make up Excel’s structure.
Look at the image down below. Rectangles in red and yellow are used to indicate the Ribbon and Sheet, respectively:
First, let’s start with explaining the Ribbon.
The Ribbon explained
Excel commands have shortcuts available through the Ribbon. An action that gives you the ability to do anything is called a command. This can be used, for instance, to introduce a table, alter the font size, or modify a cell’s color.
The Ribbon may initially appear cluttered and difficult to read. Don’t be afraid; as you gain more knowledge, using it will become easier. We frequently find ourselves using the same features repeatedly.
The App Launcher, Tabs, Groups, and Commands comprise the Ribbon. We will go over each of the Ribbon’s components in this section.

App launcher
The Office 365 navigation bar is the name of the app launcher icon, which includes nine dots. It gives you access to Word, PowerPoint, and Outlook, among other components of the Office 365 package. The Office 365 apps may be smoothly switched between with the use of an app launcher.
Tabs
The tab consists of a menu with subcategories arranged into clusters. Users can swiftly choose between menu selections that display several functional groupings by using the tabs.
Groups
Groups are collections of connected commands. The thin vertical line split divides the groups.
Commands
The buttons you use to perform activities are known as commands.
Let us now examine the Sheet. You will soon have the ability to comprehend how the Ribbon and the Sheet relate to one another and take action.
The Sheet explained
There are rows and columns in the sheet. It creates the same pattern as the rectangle boxes found in math homework books; these boxes are referred to as cells.
You can type values into cells.
Values may take the form of letters or numbers:
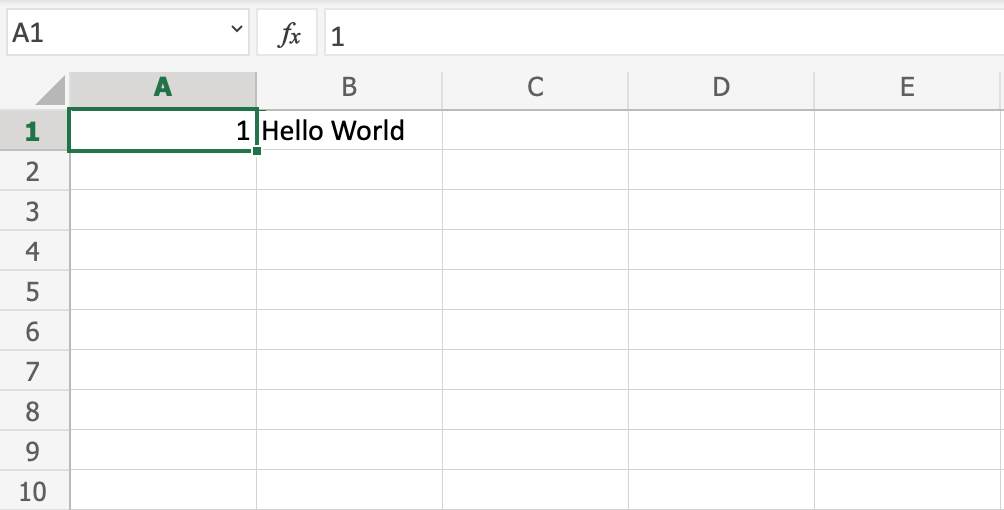
The coordinates of each cell serve as a unique point of reference; this is where the rows and columns converge.
Let’s dissect this and provide an illustration.
Look at the image down below. In cell C4, someone typed hello world. You can locate the reference by clicking on the appropriate cell. The Name Box on the left will display the reference, which indicates that the cell’s reference is C4.

Finding the column (in this case, C) and mapping it to the row (in this case, 4) yields the reference C4. This is an alternative method of locating the reference.
Note: The coordinates of the cell serve as its reference. For instance, row 4 and column C’s coordinates are contained in C4. The junction of the two is where you discover the cell. Numbers are always rows, while letters are always columns.
Multiple Sheets
When you start a new worksheet, it starts with one Sheet by default. A workbook might have a lot of sheets. It is possible to add and remove new sheets. It is possible to rename sheets to facilitate working with data sets.
Do you feel up to the task? First, let’s make two new sheets and give them meaningful titles.
First, make two new sheets by clicking the addition sign, as seen in the image below:

Tip: To make new sheets, press the hotkey Shift + F11. Give it a go!
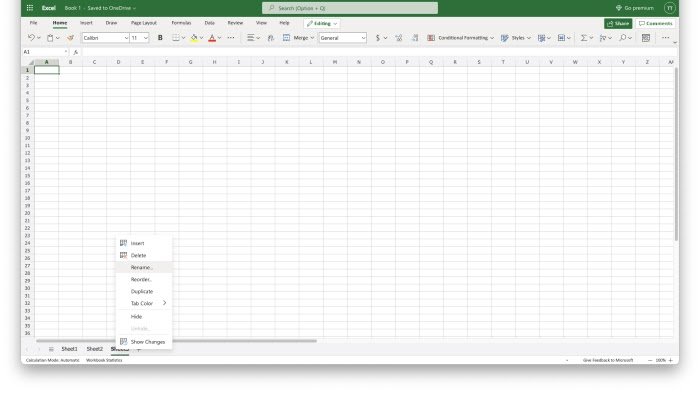
Secondly, perform a right-click on the pertinent sheet with your mouse and select “rename”:
Third, enter useful names for the three sheets:
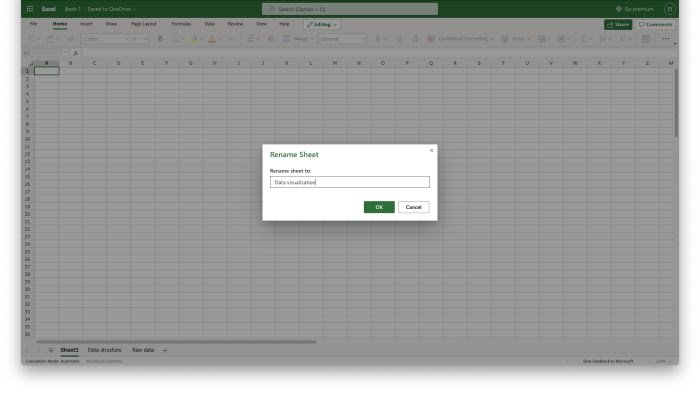
The terms “data visualization,” “data structure,” and “raw data” were used in this example. This is the standard structure you will encounter while handling data.
Well done! Now that you have three named sheets in your first workbook, congratulations!
Chapter Summary
The Ribbon and the Sheet are the two primary parts of the workbook.
To navigate and access commands, use the Ribbon.
Cells in the Sheet are composed of rows and columns.
Every cell has a distinct reference. Your workbook allows you to name and add new sheets.
You will discover more about the sheet, formulae, ranges, and functions in the upcoming chapters.
